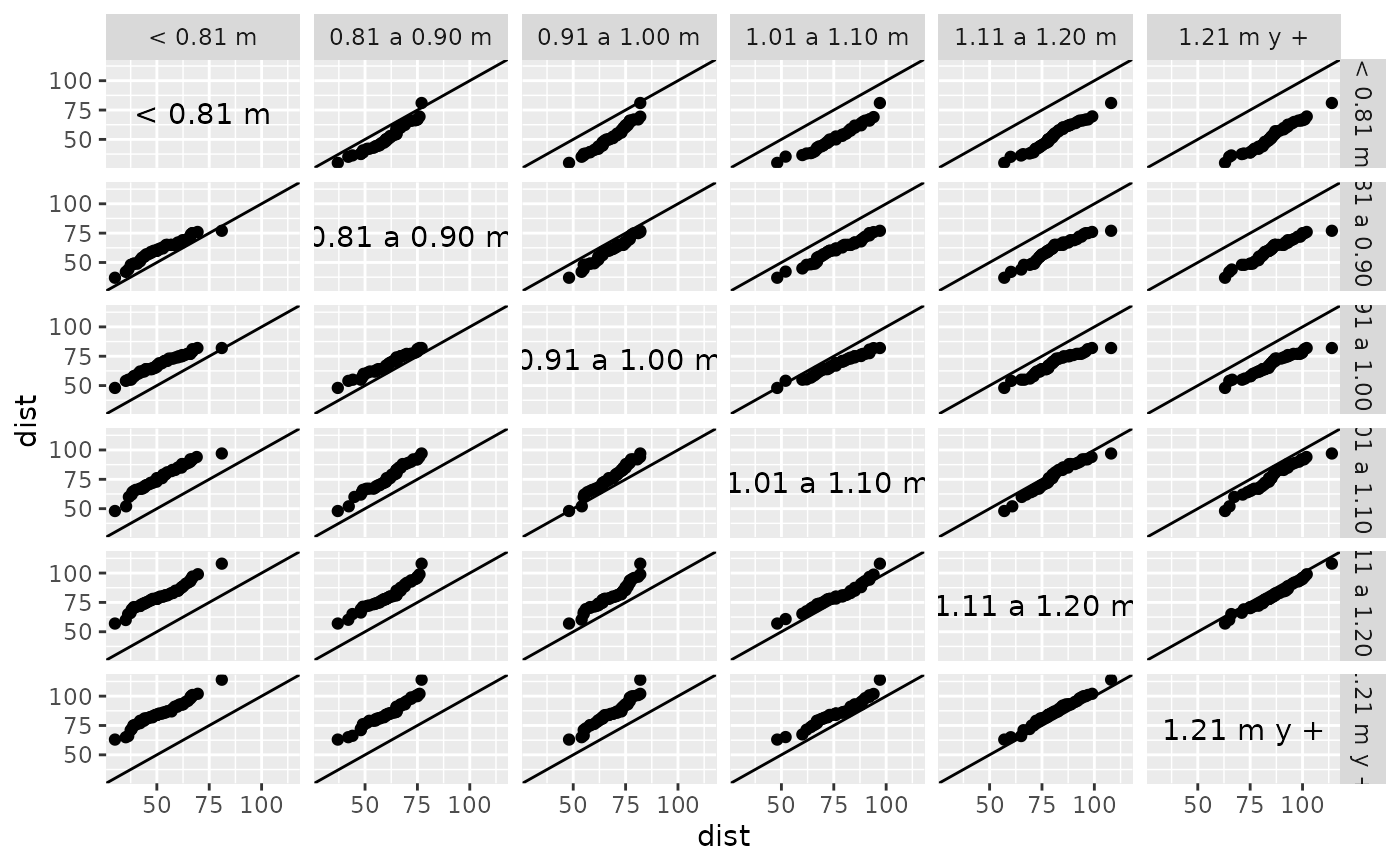
Returns a quantile-quantile plot to compare any given number of groups
gg_quantiles(
  df,
  vble,
  group,
  combined = FALSE,
  xlabel = NULL,
  ylabel = NULL,
  ...
)
Arguments
| df | dataframe |
|---|---|
| vble | numeric variable to be analized |
| group | character or factor grouping variable |
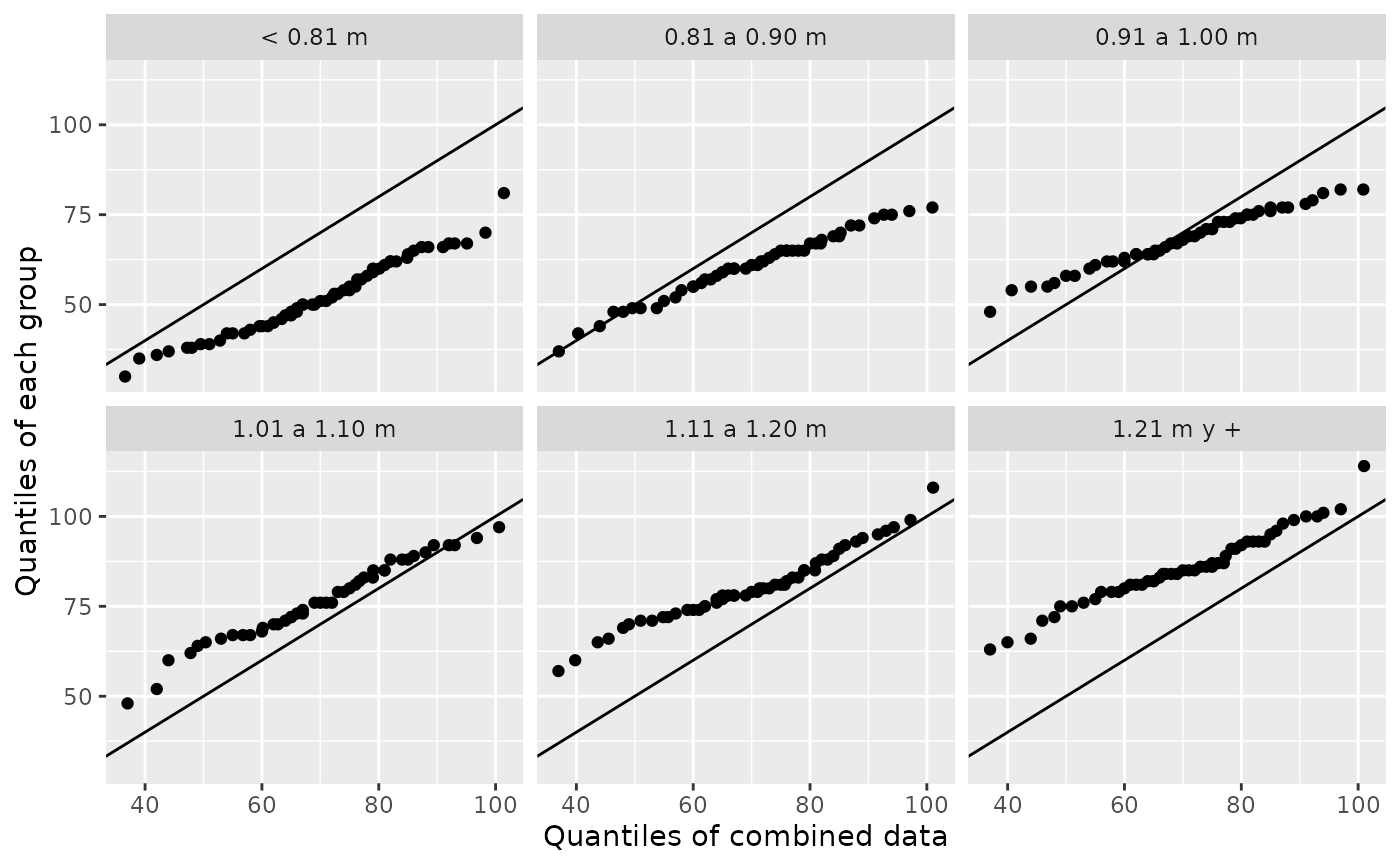
| combined | logical, defaults to FALSE, producing a matrix of pairwise QQ plots. If TRUE, it produces a QQ plot of quantiles of each group versus quantiles calculated by the combination of all groups. This is useful to study residuals from a fit. |
| xlabel | label for x-axis |
| ylabel | label for y-axis |
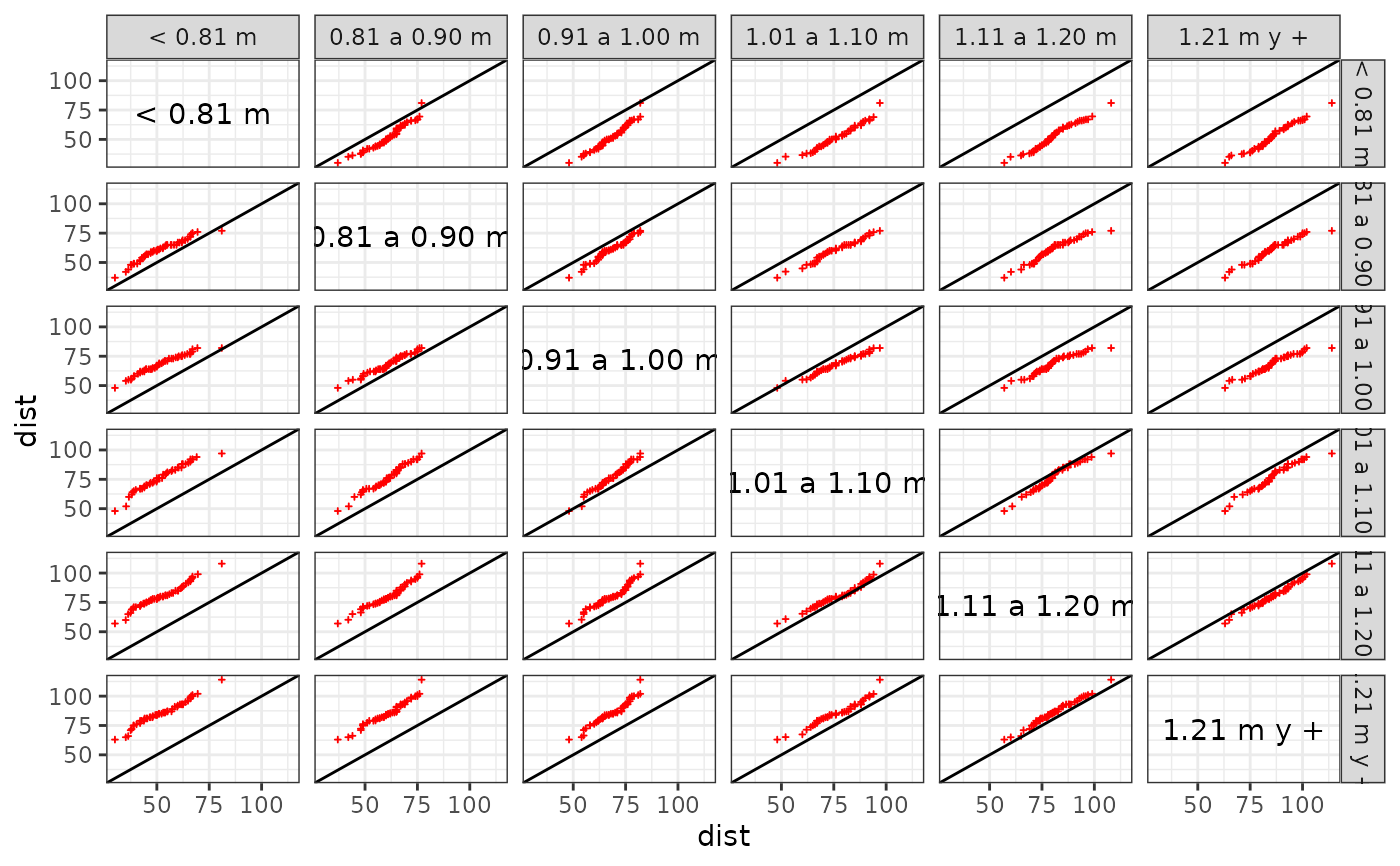
| ... | parameters to be passed to geom_point(), such as size, color, shape. |
Value
a ggplot
Examples
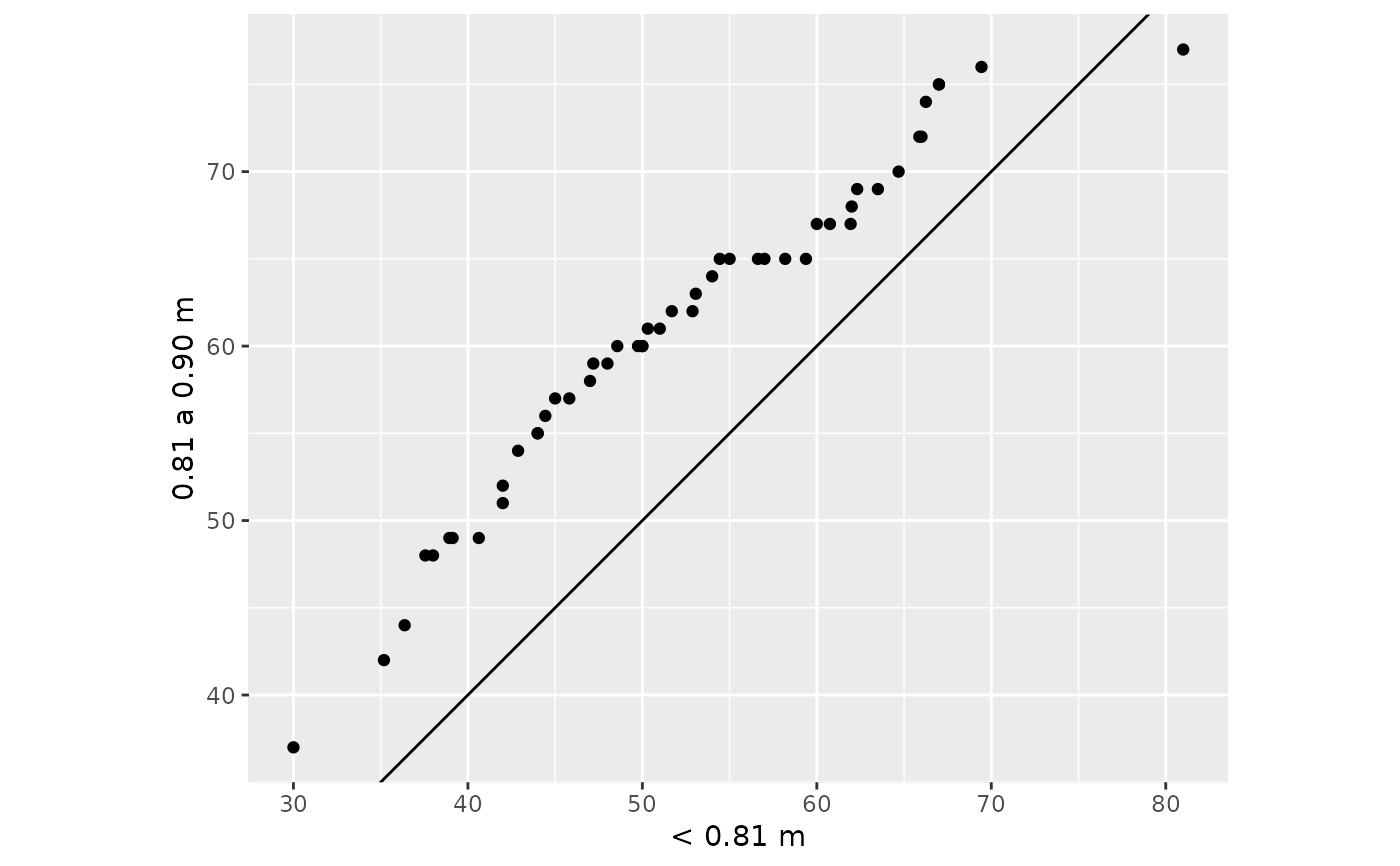
gg_quantiles(futbol, dist, longp, size = 0.4, color = "red", shape = 3) + theme(panel.spacing = unit(2, "lines")) + theme_bw()# Only 2 groups futbol2 <- dplyr::filter(futbol, longp %in% c("< 0.81 m", "0.81 a 0.90 m")) gg_quantiles(futbol2, dist, longp)# Each groups vs quantiles from all groups combined gg_quantiles(futbol, dist, longp, combined = TRUE)