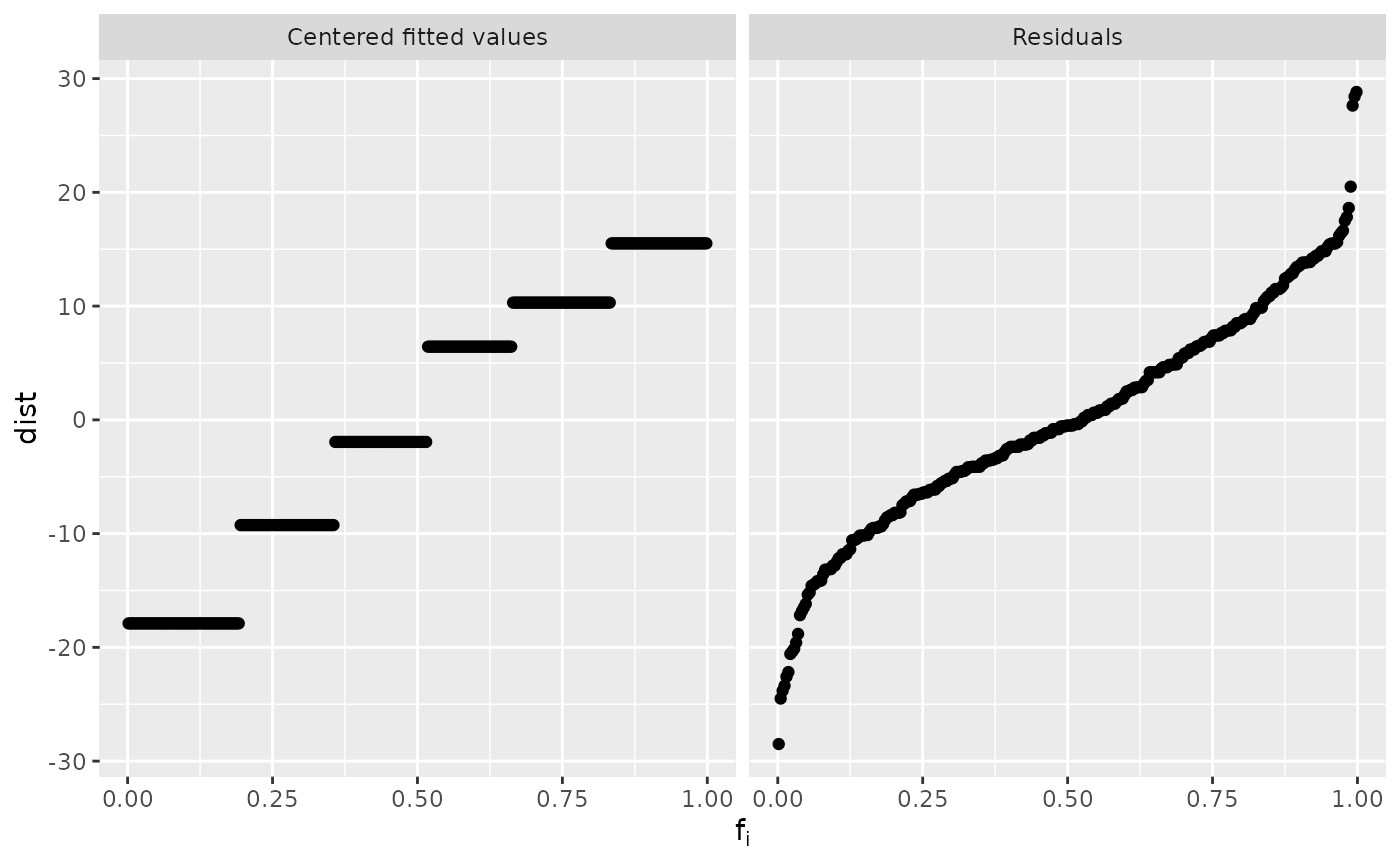
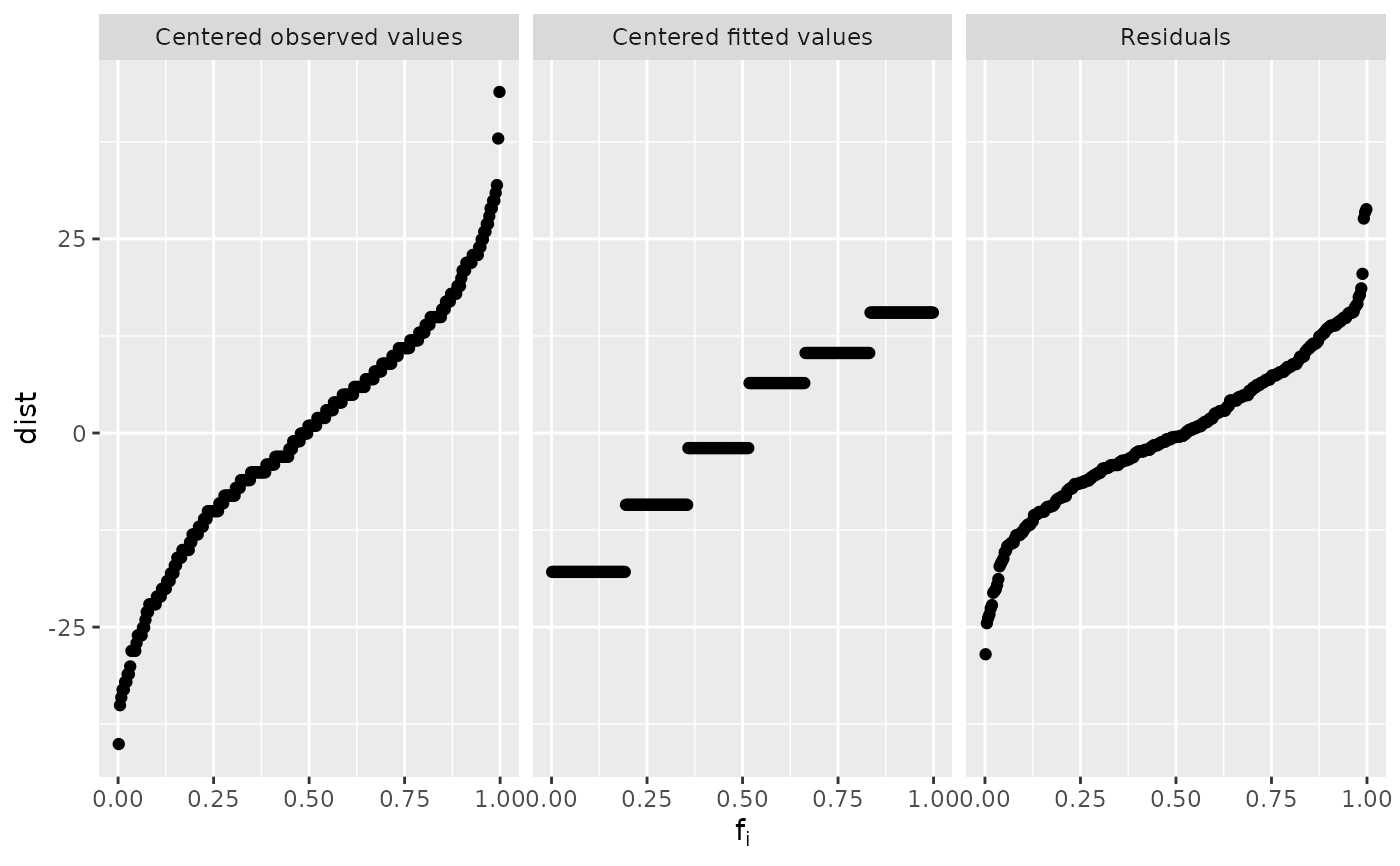
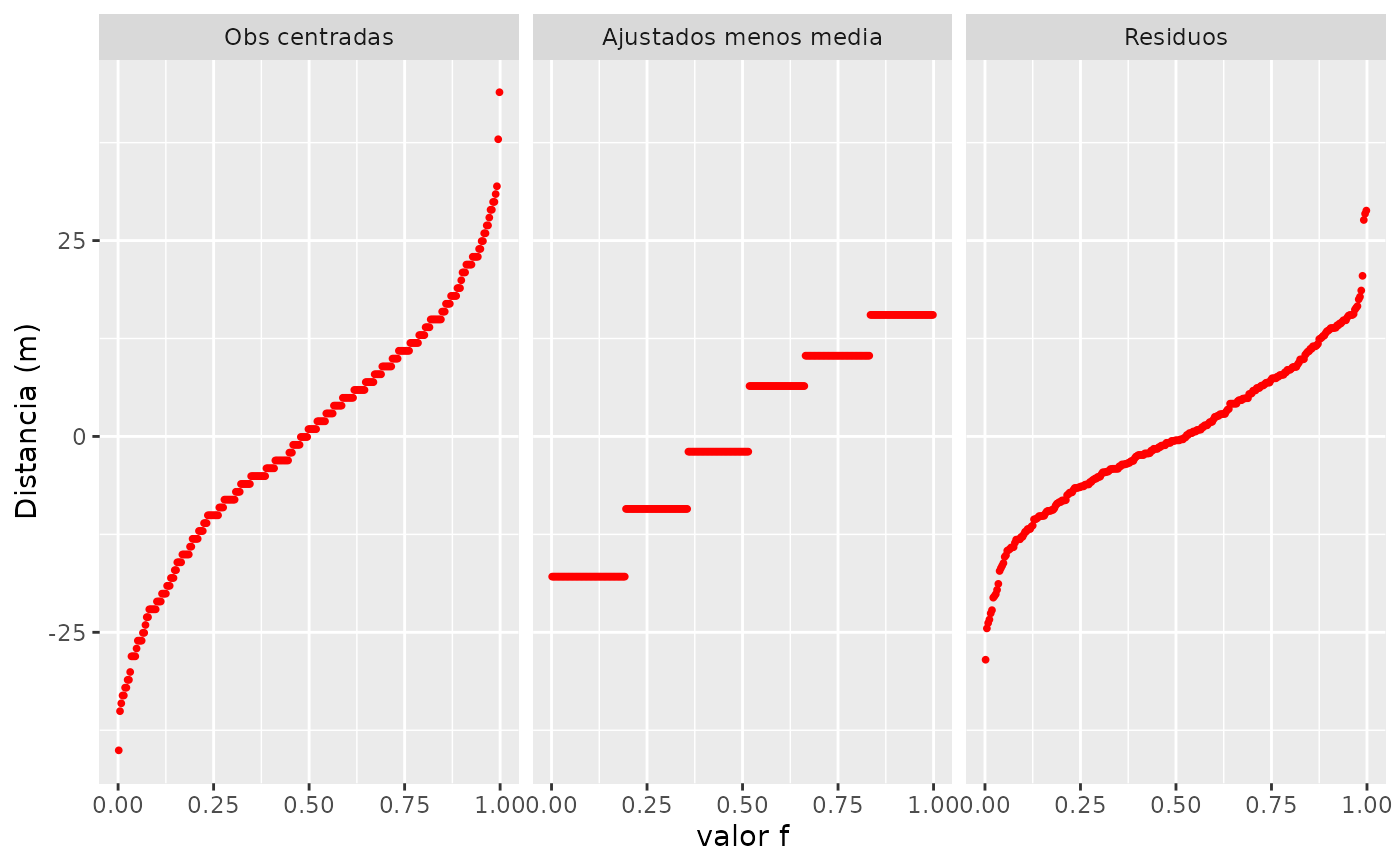
Returns a Residual-Fit plot, optionally including centered observed values
gg_rf(
  df,
  vble,
  fitted,
  res,
  cen_obs = FALSE,
  cen_obs_label = "Centered observed values",
  cen_fit_label = "Centered fitted values",
  res_label = "Residuals",
  xlabel = expression(f[i]),
  ylabel = quo_text(vble),
  ...
)
Arguments
| df | dataframe |
|---|---|
| vble | numeric variable in df with the observed values |
| fitted | numeric variable in df with the fitted values |
| res | numeric variable in df with the residuals |
| cen_obs | should centered observed values be included in a panel of their own? Defaults to FALSE. If TRUE, values are centered using the mean of all data |
| cen_obs_label | label for the panel of centered observed values |
| cen_fit_label | label for the panel of fitted values |
| res_label | label for the panel of residuals |
| xlabel | x-axis label |
| ylabel | y-axis label |
| ... | parameters to be passed to stat_qq(), such as size, color, shape. |
Value
a ggplot
Details
The option to include the centered observed values as part of this plot was inspired by work done by Eng. German Beltzer in lattice.
Examples
library(dplyr) data(futbol) datos <- futbol %>% group_by(longp) %>% mutate(ajuste = mean(dist), res = dist - ajuste) gg_rf(datos, dist, ajuste, res)gg_rf(datos, dist, ajuste, res, cen_obs = TRUE)gg_rf(datos, dist, ajuste, res, cen_obs = TRUE, cen_obs_label = "Obs centradas", cen_fit_label = "Ajustados menos media", res_label = "Residuos", xlabel = "valor f", ylabel = "Distancia (m)", color = "red", size = 0.7)