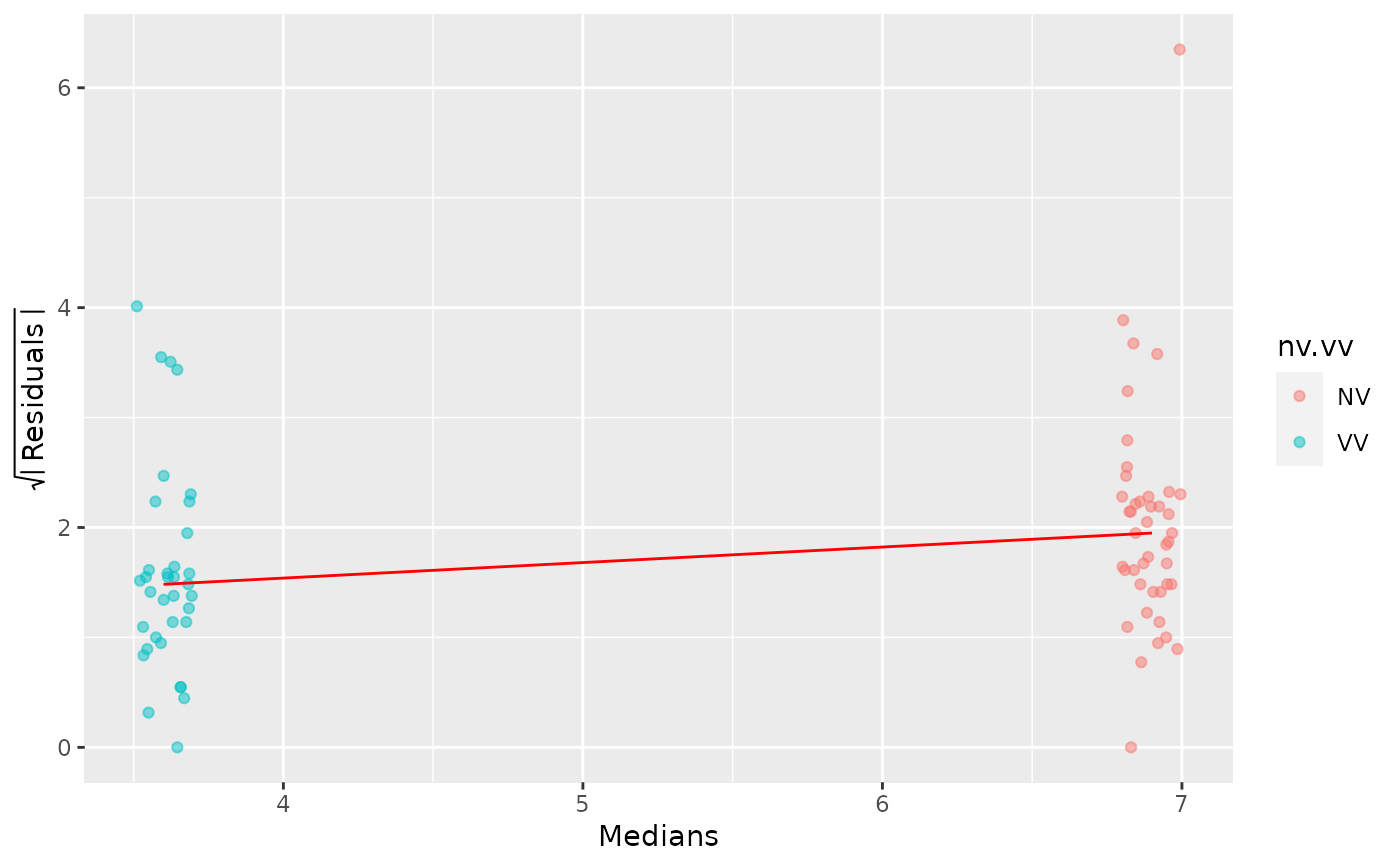
Returns a spread-location plot.
gg_sl(
  df,
  vble,
  group,
  jitterwidth = 0.1,
  jitteralpha = 0.5,
  linecol = "red",
  ylabel = expression(sqrt(abs(" Residuals "))),
  xlabel = "Medians"
)
Arguments
| df | dataframe |
|---|---|
| vble | numeric variable to be analized |
| group | grouping character or factor variable |
| jitterwidth | width argument for geom_jitter |
| jitteralpha | alpha argument for geom_jitter |
| linecol | col argument for geom_line |
| ylabel | y-axis label |
| xlabel | x-axis label |
Value
a ggplot object with the spread-location plot
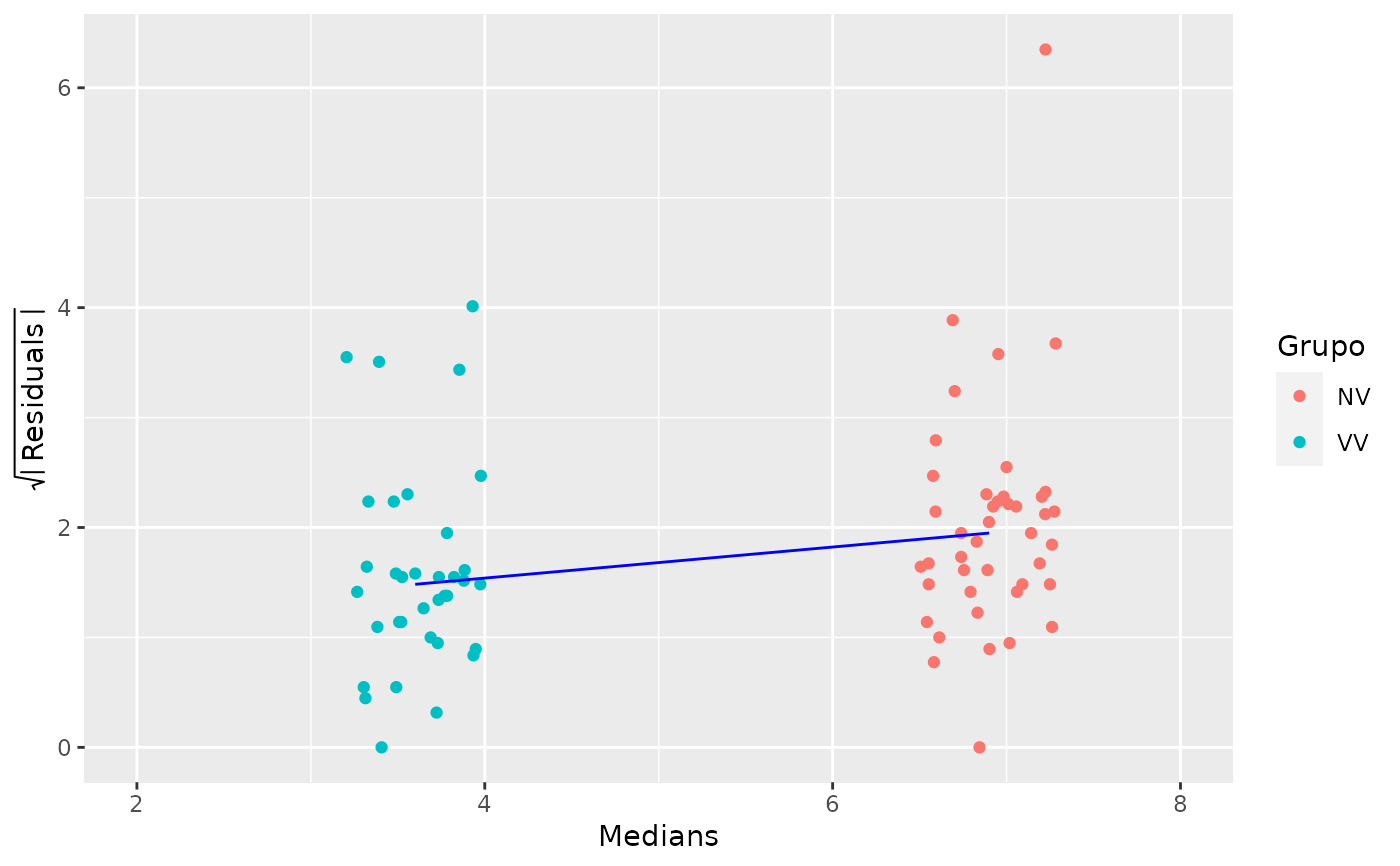
Examples
gg_sl(fusion, time, nv.vv, jitterwidth = 0.4, linecol = "blue", jitteralpha = 1) + scale_color_discrete("Grupo") + xlim(2, 8)