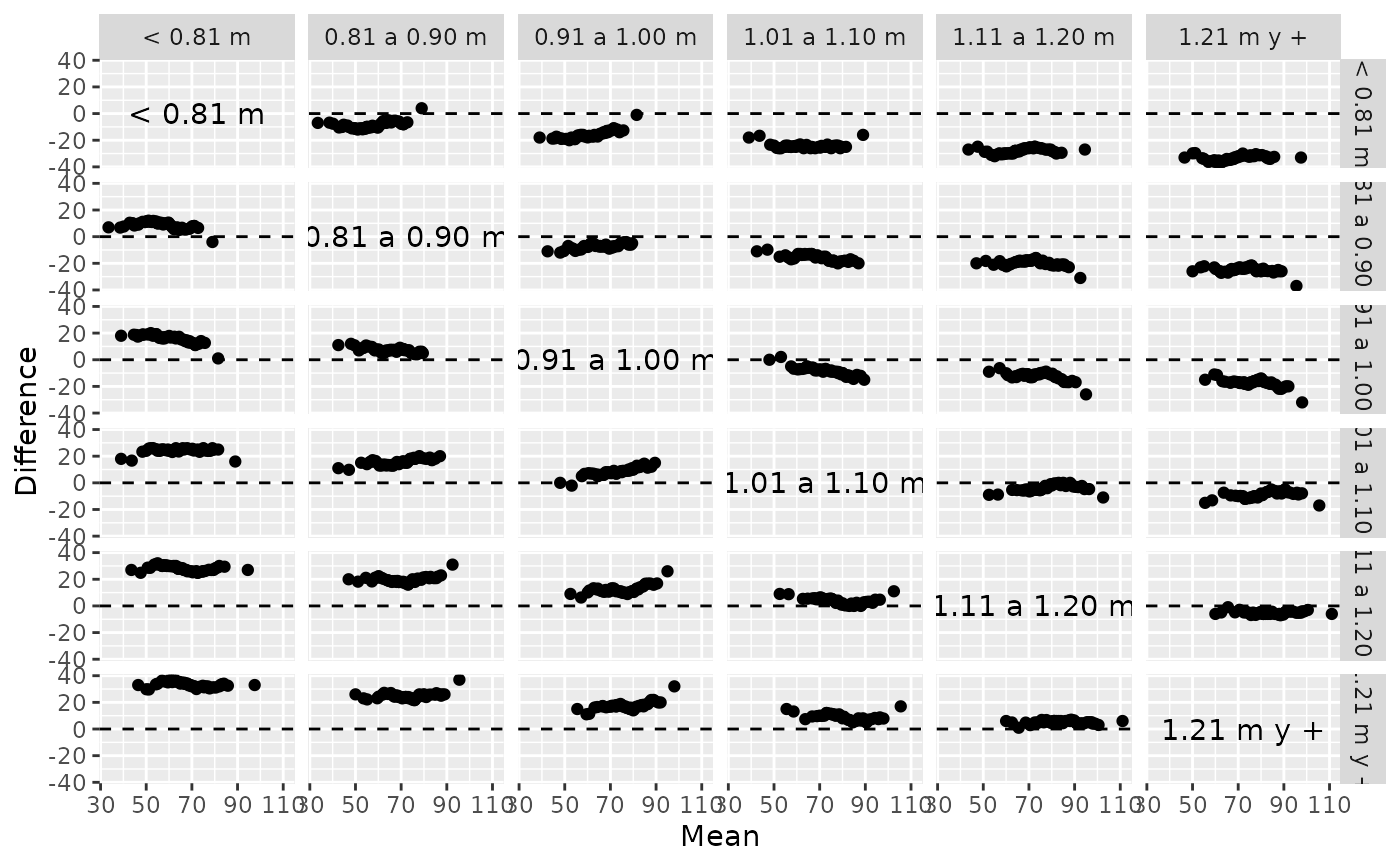
Returns Tukey's Mean-Difference plot for one-way data
gg_tmd(df, vble, group, xlabel = "Mean", ylabel = "Difference", ...)
Arguments
| df | dataframe |
|---|---|
| vble | numeric variable to be analized |
| group | character or factor grouping variable |
| xlabel | label for x-axis, defaults to "Mean" |
| ylabel | label for y-axis, defaults to "Difference" |
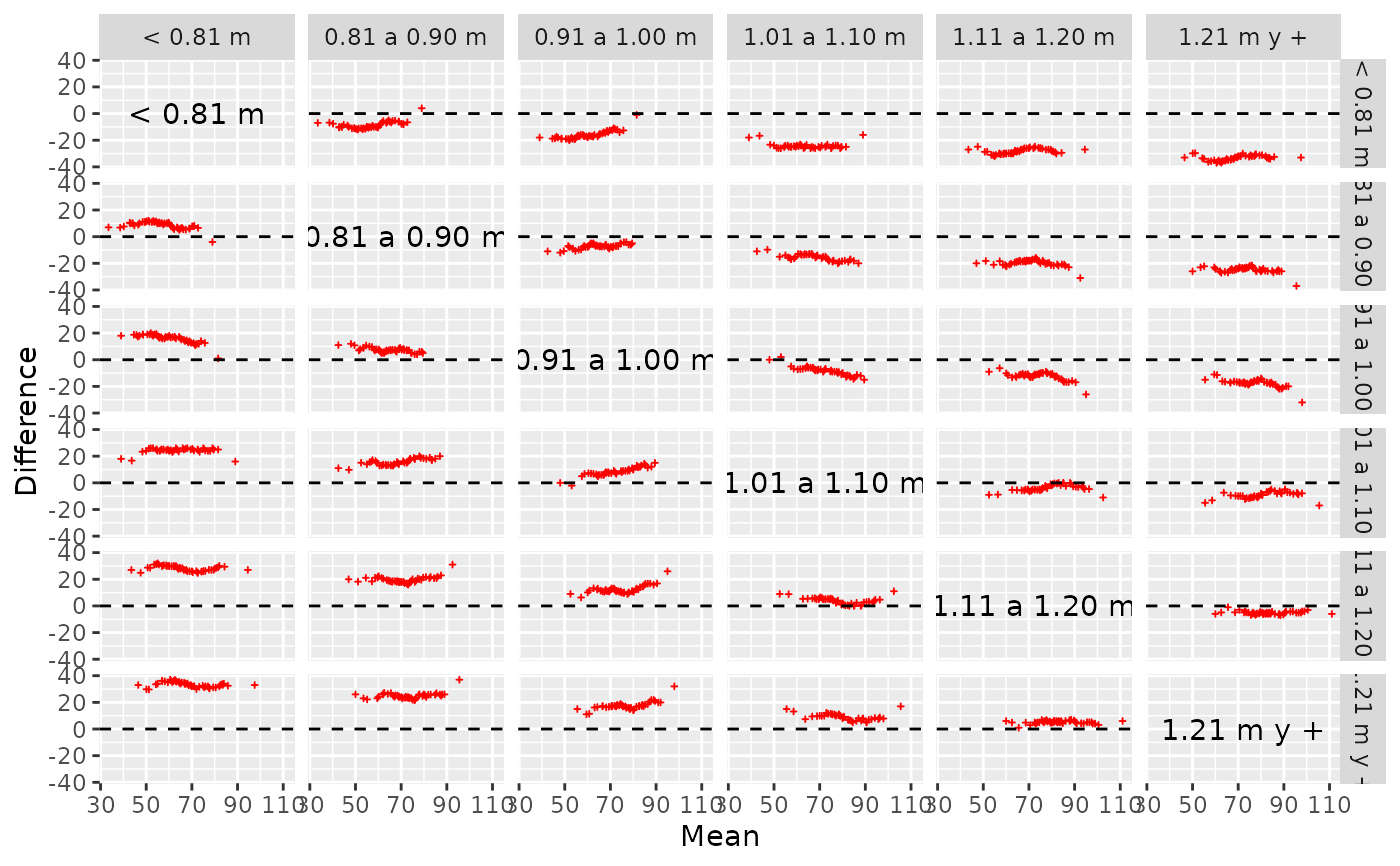
| ... | parameters to be passed to geom_point(), such as size, color, shape. |
Value
a ggplot
Examples
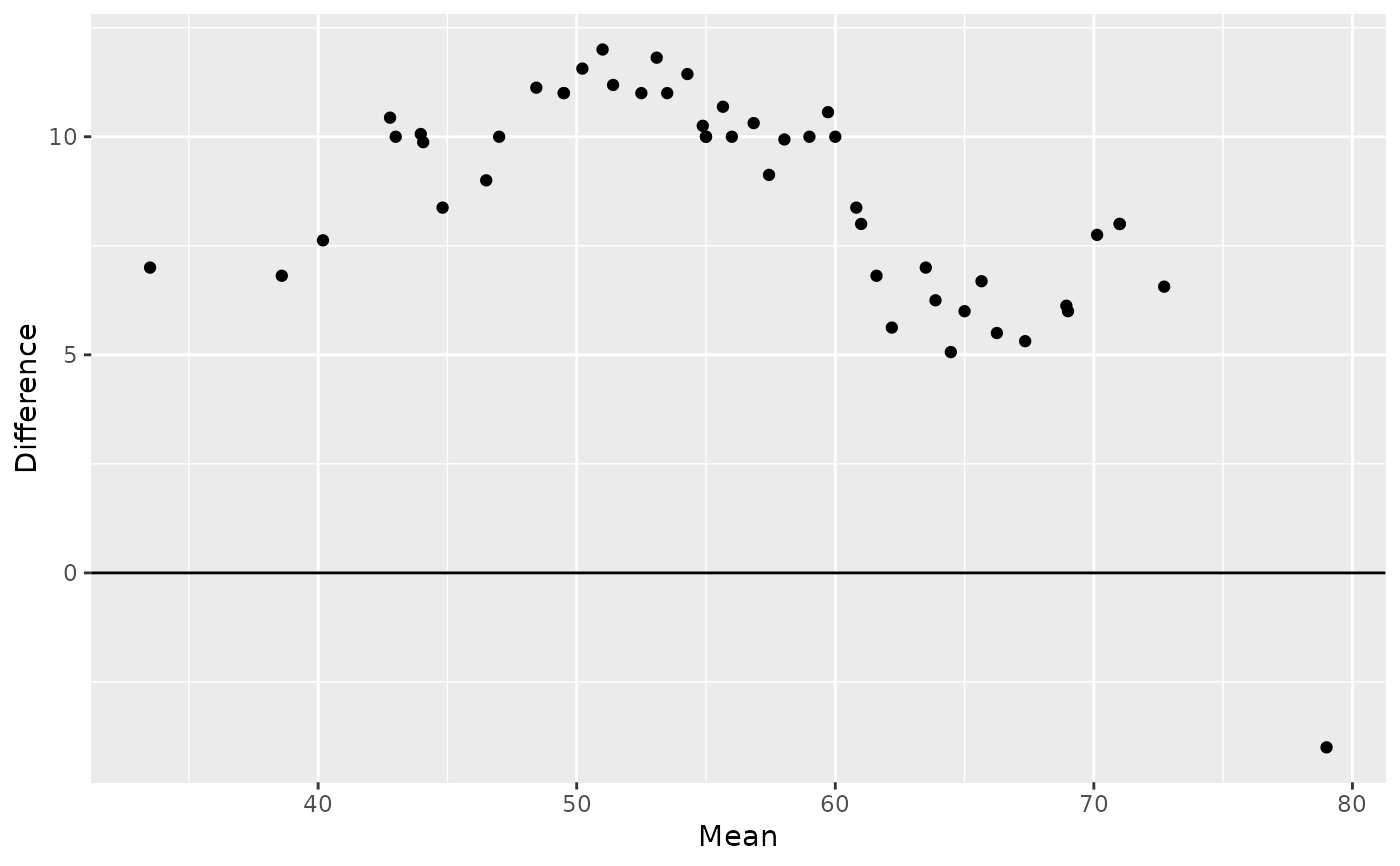
gg_tmd(futbol, dist, longp, size = 0.4, color = "red", shape = 3)# Only 2 groups futbol %>% filter(longp %in% c("< 0.81 m", "0.81 a 0.90 m")) %>% gg_tmd(dist, longp)