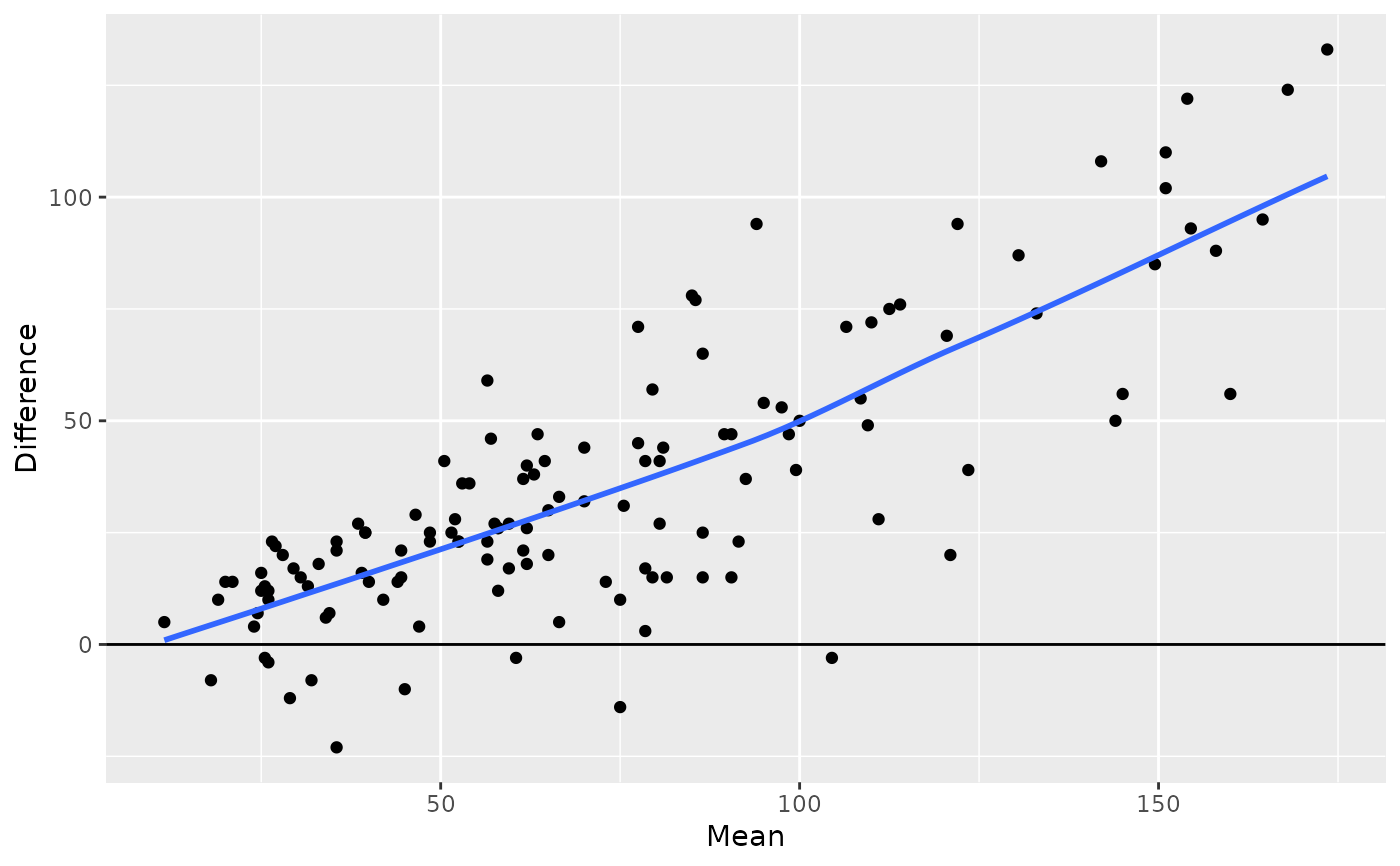
Returns Tukey's Mean-Difference plot for paired data (both variables must be measured in the same scale).
gg_tmd_paired(
  df,
  vble1,
  vble2,
  xlabel = "Mean",
  ylabel = "Difference",
  loess = TRUE,
  loess_span = 1,
  loess_degree = 1,
  loess_family = "gaussian",
  ...
)
Arguments
| df | dataframe |
|---|---|
| vble1, vble2 | numeric variables to be analized |
| xlabel | label for x-axis, defaults to "Mean" |
| ylabel | label for y-axis, defaults to "Difference" |
| loess | logical; should a loess smoothing curve be added to the coplots? Defaults to TRUE. |
| loess_span | span parameter for loess |
| loess_degree | degree parameter for loess |
| loess_family | famiyly argument for the loess() function |
| ... | parameters to be passed to geom_point(), such as size, color, shape. |
Value
a ggplot
Details
Differences are computed as `vble1 - vble2`.
Examples
gg_tmd_paired(ozone, stamford, yonkers)#>